> For the complete documentation index, see [llms.txt](https://docs.konvu.com/konvu/llms.txt). Markdown versions of documentation pages are available by appending `.md` to page URLs; this page is available as [Markdown](https://docs.konvu.com/konvu/triage-and-remediation/monitor-and-deliver/inventory.md).
# Inventory
Every repository and manifest Konvu knows about, with its threat profile tier, detected stack, and assessment coverage.
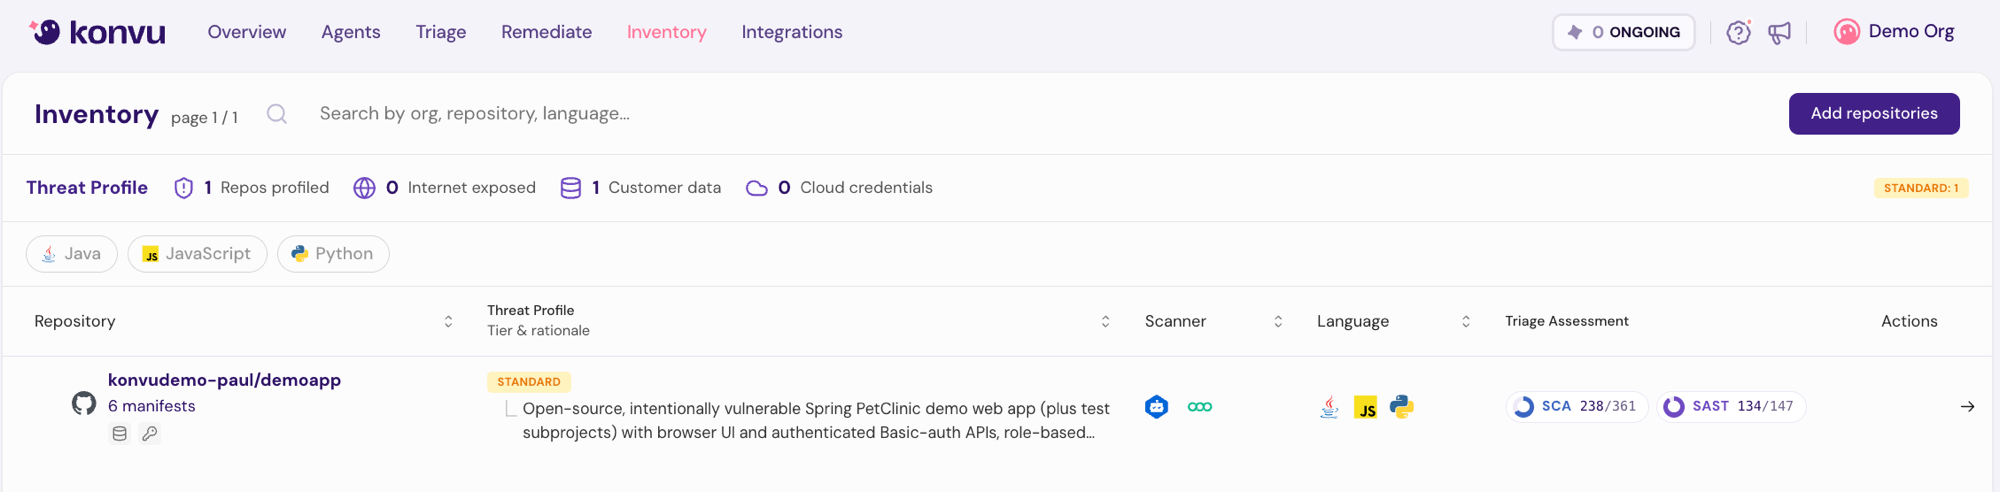
The Inventory page is the list of everything Konvu has onboarded: your repositories, the dependency manifests inside them, and how far assessment has progressed on each. Use it to check coverage, find the repositories that matter, and open a repository to see why Konvu ranks it the way it does.
Rows are grouped by repository. Expand a repository to see its manifest locations, one per dependency manifest (`pom.xml`, `package.json`, `requirements.txt`, and so on). Repositories with many manifests page through them 25 at a time.
The Inventory table, with the Threat Profile rollup band and language quick chips above it
## The Threat Profile band
Above the table, a summary band rolls up your estate: how many repositories have been profiled, and how many are internet exposed, handle customer data, or hold cloud credentials. On the right, a badge per tier shows the distribution (`CROWN JEWEL: 3`, `STANDARD: 12`, and so on). See [Threat Profiles](/konvu/triage-and-remediation/monitor-and-deliver/inventory/threat-profiles.md).
## Columns
| Column | What it shows |
| --------------------- | ------------------------------------------------------------------------------------------------------------------------------------------------------------------------------------------------------------------------------------------------------ |
| **Repository** | The repository name, its manifest count, and icons for the threat signals Konvu detected: internet exposed, customer data, cloud credentials, secrets, production access. Hover an icon for its label. |
| **Threat Profile** | The tier (Crown Jewel, Key Asset, Standard, Peripheral) and the rationale behind it. A repository row shows the highest tier across its manifests. |
| **Scanner** | Which connected scanners report on this repository. |
| **Language** | The technology detected for the repository or manifest. |
| **Triage Assessment** | One chip per product (SCA, SAST) showing open assessed over open total, with a coverage ring. Hover a chip to break the repository down into Open (assessed, unassessed) and Closed (fixed, dismissed). Each row links into that product's Triage tab. |
| **Actions** | Jump to the findings for that repository. |
## Search and filters
Search by organization, repository, or language. Values commit as chips, so you can stack several filters:
* Organization, repository, branch, scanner, language
* Framework, frontend/backend, environment, database, web server, operating system, architecture
* Runtime versions: Java, Python, Go, Ruby VM
The repository box also accepts a glob pattern, so `payments-*` scopes the view to every repository whose name matches. The quick chips under the search bar filter by the languages present in your estate in one click.
## The repository drawer
Click a repository to open its drawer:
* **Risk profile** and **Threat context**: the repository's tier and the evidence behind each dimension. See [Threat Profiles](/konvu/triage-and-remediation/monitor-and-deliver/inventory/threat-profiles.md).
* **Technology stack**: the frameworks, databases, web servers, and runtime versions Konvu detected.
Press `J` and `K` to move between repositories without closing the drawer.
{% hint style="info" %}
The technology stack is detected during analysis, not entered by hand. If something looks wrong, tell Konvu instead of working around it.
{% endhint %}
## Adding repositories
**Add repositories** in the top right onboards more repositories from a connected integration. If nothing is connected yet, start with [Import Your Findings](/konvu/get-started/bring-in-findings.md) and [Connect Your Environment](/konvu/get-started/connect-your-environment.md).
## From the CLI
```bash
# Org-wide rollup: tier distribution and the top repositories by score
konvu inventory
# The full threat profile for one repository
konvu inventory show org/repo
```
## Next steps
* [Threat Profiles](/konvu/triage-and-remediation/monitor-and-deliver/inventory/threat-profiles.md): how the tier in the Threat Profile column is derived.
* [Triage List View](/konvu/triage-and-remediation/triage/triage-list-view.md): work through the findings behind the Triage Assessment chips.
* [Dashboard & Overview](/konvu/triage-and-remediation/monitor-and-deliver/dashboard-and-overview.md): org-wide posture metrics.
---
# Agent Instructions
This documentation is published with GitBook. GitBook is the documentation platform designed so that both humans and AI agents can read, navigate, and reason over technical content effectively. Learn more at gitbook.com.
## Querying This Documentation
If you need additional information that is not directly available in this page, you can query the documentation by asking a question.
Perform an HTTP GET request on the following URL with the `ask` and `goal` query parameters:
```
GET https://docs.konvu.com/konvu/triage-and-remediation/monitor-and-deliver/inventory.md?ask=&goal=
```
`ask` is the immediate question: it should be specific, self-contained, and written in natural language.
`goal` is what the user is ultimately trying to achieve, the reason they need the answer. Sharing it helps GitBook give you a better, more relevant answer. A goal is most helpful when it describes the outcome the user wants rather than restating the question. For example, with `ask=how do I create an API token`, a goal like `automate deployments from our CI pipeline` lets GitBook tailor the answer to that use case.
The response will contain a direct answer to the question and relevant excerpts and sources from the documentation.
Use this mechanism when the answer is not explicitly present in the current page, you need clarification or additional context, or you want to retrieve related documentation sections.